I spent much of the pandemic, from late 2020 until December 2023, building a new family home. In Australia power efficiency for cooling (and heating) are critical. We minimised the size of north-facing windows, and ensured that thermal insulation was installed in the double-brick exterior walls, as well as sisal insulation under the roof tiles and Colorbond sheets, and then standard insulation above the ceilings. Lighting is almost exclusively LEDs.
Exterior (garden) smart lighting is configured to come on at sunset, then dim to 50% brightness at 10pm, and then further dim to 3% at 11pm, turning off at sunrise.
One key point was using our roof space for solar power, and so we commissioned a 10 KW inverter, and a single Tesla Powerwall 2, which was installed post-handover of the property in mid December 2023.
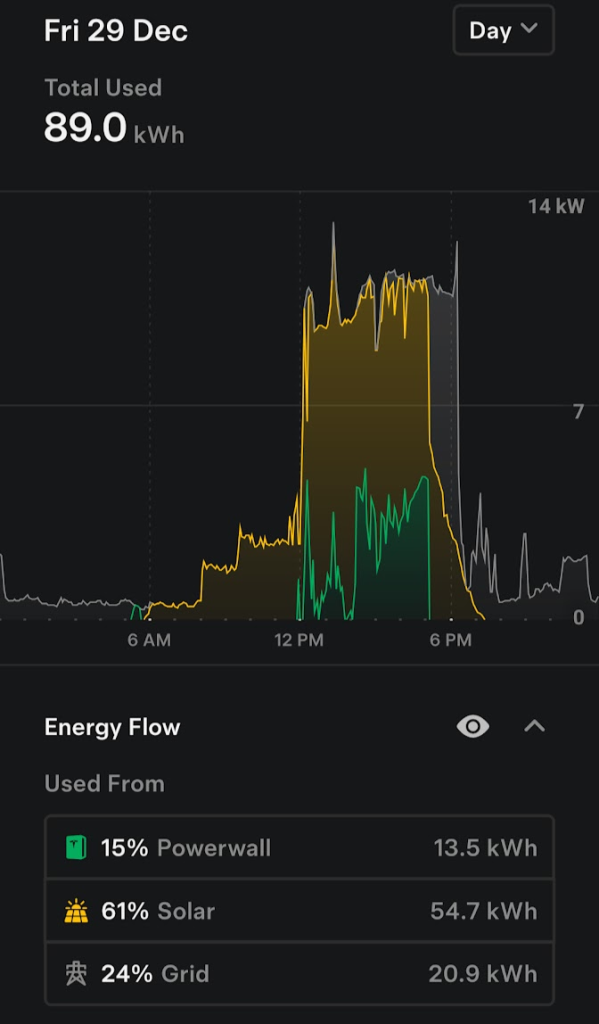
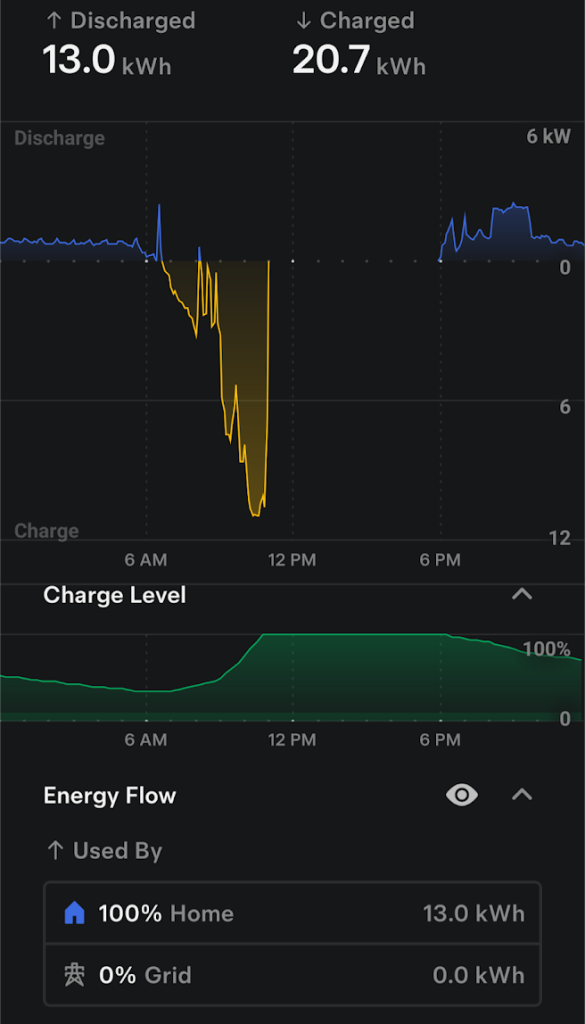
In January of 2024, we saw around 68% of our power usage was from the installed power system. The air conditioner was the biggest draw, on hot days it would run at a draw of 10 – 11 KW, and despite there being energy in the Powerwall, its limit was 5KW in and out (this is now increased in the PowerWall 3).
Even without the air conditioner, most days the PowerWall would be exhausted by around midnight, leaving just the grid supplying until the sun came up the next day.
Here’s what December 29th looked like for me:

To further reduce power from the grid, I added a second set of panels on an additional 5KW inverter in May 2024.
By October 2024, the days in the southern hemisphere are getting longer, and the two inverters were at 100% load from mid-morning until 5pm or later, and we hit 90% of power coming from solar + battery for the month.
At this time, the Powerwall 2 was being discontinued, and existing PowerWall 2 installs cannot be expanded with PowerWall 3 units, so we divde in one more time and installed a second PowerWall in late October.
Since that second, we have not purchased any power from the grid.

Of course, we have yet to see the intense heat (and thus air conditioning draw) that February and March shows in my area.
You’ll also note that most of our power usage is in the afternoon and evening, meaning the mornings are great time to charge batteries up:

So what does that look like as a percentage saving per day:

I typically work from home these days (a global role that kicks in and out from9am until 10pm or later depending on the teams I am working with), but in an IT role means my work is mostly having my laptop (and screens) on.
One key question is the break even on this. If I use the last 3 weeks worth of data then it works out at a break even time of 7 years and 2 months. The last 300 days shows a 11 year break-even, but most of those 300 days did not have the 2nd PowerWall, nor the additional 5KW of solar generation. I imagine this will end up around an 8 years break even, within the 10 years warranty period of the battery, solar panels and inverters.
Two other points I get asked about:
- we put in a total of 15 KW of inverters as we have three phase power to the property; in our area the power company limits the size of inverter(s) you can installed depending upon 3 phase or single phase supply
- Having installed more than 5KW, the buy back for power fed back into the grid is $0.00. Nothing. Hence my system is set to reduce the amount fed to the grid, instead of sending as much as possible. If that was even $0.01 I’d remove that limit.
The cost of power from my provider, Synergy, increased on 1 July 2024 from 30.812c/KWH to 31.5823, or 2.5%. The connection fee (without consumption), went up from $1.1046/day, to $1.1322/day (just shy of 2.5%). This means I am still paying $413 per year (and increasing) to be connected to the grid, in case I run out of juice.
While I am no fan of the Tesla owner (and now government appointee?!), the technology appears to be sound, thus far. I’m pleased to have reduced my use of grid power to zero.
Lets see what the next 12 months of data produces.
